Visualisation Challenges
Having sufficient granular energy data that goes beyond mere billing information.
Focus away from electricity only to a multi-utility and energy data platform.
Data input from multiple sources.
Presenting data in ways that are easy to interpret.
Making energy information accessible and meaningful to non- energy experts.

Business Benefits
‘Seeing’ energy usage in easy to view graphical representations helps enables you to fully understand your consumption.
Near real-time dashboard presentation of energy information engages staff, promotes sustainability credentials and supports behaviour change.
Easy-to-interpret outputs help organisations make informed energy strategy decisions.

What We Offer
A sophisticated web-based energy management and presentation tool.
Clear graphical representations of energy.
Presentation of energy as real ‘intelligence’ and not just data.
Data translated into appropriate formats for different stakeholder groups.
Interpretation of energy usage in ways that are easily understood and identified with by non-energy experts.
Viewer
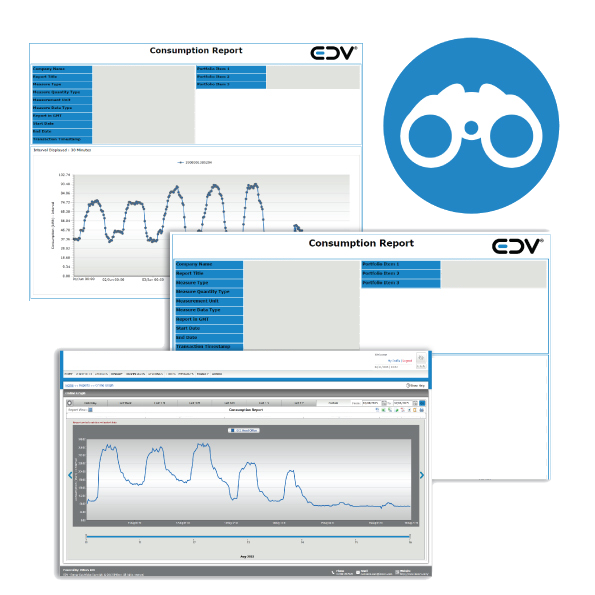
End to end view of your entire energy portfolio; from electricity, gas and water, to boiler temperature, control data and lighting.
Benefits
- Secure robust solution for access anytime, anywhere.
- Complex energy data made simple.
- Quick analysis of data allowing time to be spent achieving energy savings.
- Entire company portfolio managed in a single location.
- Flexibility to model your data according to company structure or cost centre needs for grouping and reporting.
Features
- Easy access to whole portfolio of energy data in one secure system.
- Collation of all energy data and related data in one place, regardless of source.
- Visibility of energy patterns over time.
- Comparison of data at measure level or up to group and regional level.
- Capture renewable energy exports as well as energy consumption data.
- Not tied to a single supplier or data solution.
- Scheduled export of data consumption or graphical presentation.
Illustrator
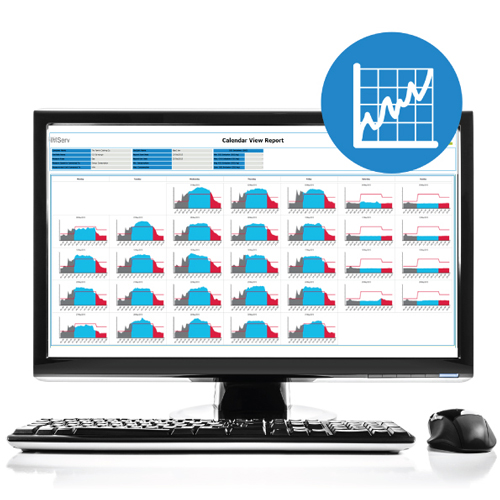
Quick access to professionally
presented reports.
Benefits
All the benefits of viewer, plus;
- Time efficiency through automatic report production.
- Easily identify poor electrical efficiency.
- Key electrical data for budgeting and purchasing decisions.
- Quick view of incomplete data for issue resolution.
- Customer control of system administration.
Features
All the benefits of viewer, plus;
- Control different user visibility and use of the system to allow differing access.
- Ability to create numerous energy management reports using flexible templates.
- Scheduling module to allow submission of reporting to multiple recipients.
- Scheduling tool to automate future production of reports.
- Central storage of energy related documents.
- Storage of energy management reports for quick access online.
Illustrator+
Progressive Analysis of your Energy.
Benefits
All the benefits of viewer and illustrator, plus;
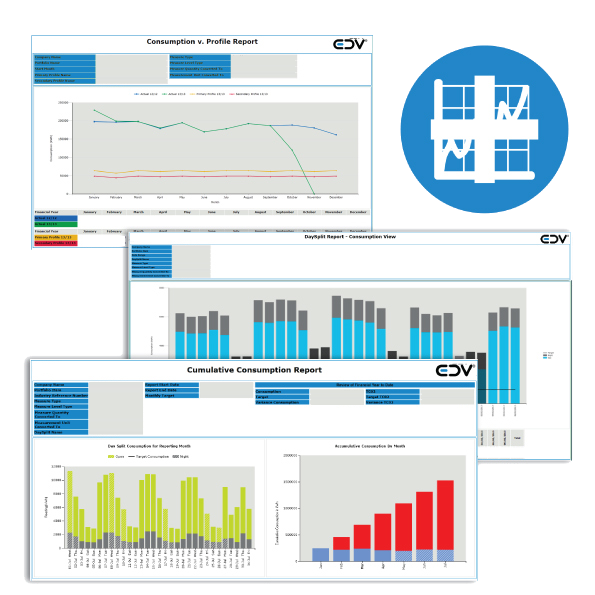
- Set of finance reports to understand and manage cost.
- Carbon reports to understand environmental impact.
- Proactive analysis of site data through alerts.
- Storage of energy tariffs for accurate financial reports.
- Ability to calculate tenant energy charges.
Features
All the benefits of viewer and illustrator, plus;
- Suite of report templates to allow 100's of report types to be created.
- Alerting module to support proactive analysis of site data against profiles, capacity and thresholds.
- Alerting module that allows actual or comparison values to be used in alert settings.
- Ability to schedule alerts.
- Tariff Management.
- Tenant billing.
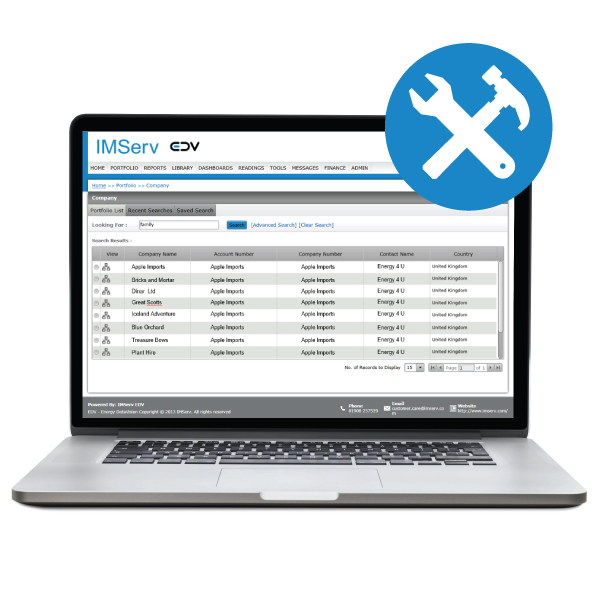
Advisor
Giving Partner organisations the ability to manage customer accounts.
Benefits
- Provide additional services to your customers along with your existing energy service offerings.
- Give your customers on-going visibility of your business and solutions.
- Provide visibility of cost reduction from energy saving installations.
- A service delivery portal to enable you to support an end to end product offering.
Features
- Set up of end user accounts.
- Account management of customers service.
- Account reporting tools providing useful statistics on your service delivery.
- Query management to allow issues to be managed and made visible until resolved.
- Branded options available.
